HOW WALK MAKES HEALTHY AND FIT


Walking makes us healthy. It maintains and improve our health. Walking can be done any time in a day and it requires less or no equipment. A study conducted in 2007 about inactive women depicts that even 75 minutes walk per week makes the person fit as compared to non exercising groups. Walking is a great form of physical activity for the people who are overweight, elder and who have not walked for long time. 

HEALTH BENEFITS FROM WALKING

The benefits gained from walking are as follows:

  • increased cardiovascular and pulmonary fitness
  • strong bones, improve balance
  • increase muscles strength
  • reduce body fat
  • improved management of conditions such as hypertension, diabetes, high cholesterol, high muscular pain
  • walking makes you happy
  • walking boosts vitamin D
  • It prevents dementia
  • It tones up legs, bums and tums
  • It gives us energy
Different studies show that regular exercise lowers the risks to certain cancers  such as breast and colon cancers.

PEDOMETER USE

A pedometer is used to measure that how much steps a person walks. A person should wear it while walking. It motivates the people to do more walk and do better than before. 

WALKING TIME

Walking for 30 minutes is beneficial for health. Moderate walking poses the little risks to health but patients must consult with doctor before initiating any new program of health exercise. It is difficult to walk for continuous 30 minutes. but to make it a habit you can start with dividing them into three sessions each of 10 minutes in day. Gradually it becomes a habit. In case for the purpose to lose the weight exercise  must be done for more than 30 minutes in a day but here also the habit is built gradually by starting the walk for less time than increasing the time.

To build the walking routine some suggestions are as follows:
  • Walk to shops rather than by drive
  • Walk the dog
  • Get off local transport and walk to home or office 
  • Take the stairs instead of lift

GROUND WATER SOURCES GENERAL REMARKS


The water that is percolated in the ground is known as groundwater. 
It is brought on the surface for use. The following points need to be taken into account regarding underground sources:

a) AQUIFERS

The surface of each aquifers is composed of alternate pervious and impervious layers. Pervious strata are those strata through which water can easily pass while impervious strata are those through which water cannot pass. 

The pervious layers are named as aquifers or water holding strata. Aquifers have sand or gravel layer that provides the good quality water. The aquifers that are made of limestone layer gives good quantity of water supply and cracks or fissures are present there.

b) MOVEMENT OF GROUNDWATER

The movement of underground water is through gravity and attraction of molecules of surface tension.

c) POROSITY 

The porosity is defined as the ratio of volume of pores or openings of material to the volume of total volume of material. Porosity is measured in percentage. 

P= V1/V2×100

P= Porosity of soil
V1=  Volume of openings of material
V2= Total Volume of  material

Name of Rock or Soil                                          Porosity in %

Clay                                                                         44-47          
Chalk                                                                      14-15          
Limestone                                                              0.5-17          
Sand and Gravel                                                    35-40          
Sandstone                                                                 4-30          
Compacted Sand and Gravel                               25-30          
Top Soils                                                                 37-65          

d) QUALITY OF WATER

The process of natural filtration occurs when rainfall occurs and rain water percolates through the ground.That's why underground water is free from impurities.Some quantity of bacteria are also present in water. that protect the water from contamination. The groundwater contains different salts depending upon the type of strata and length of underground water flow. The minerals present in underground water are manganese, magnesium, calcium, potassium, sodium and iron. 

Rocky strata give more or less pure water.
water with clayey soil have high turbidity.
Aquifers made of limestone provides long passage of underground water.

e) WATER TABLE

The upper top soil at ground level is pervious and the rain water is percolated through this pervious layer and gathered here.This upper surface of free water is called as Water table of groundwater table.

Water table level changes. It increases in the wet season and falls down in dry season. 


SURFACE WATER RESOURCES AND THEIR WATER QUALITY


SURFACE SOURCES

Surface water resources includes three types of sources

1) Lakes and Streams
2) Rivers
3) Storage Reservoirs

1) LAKES AND STREAMS


A natural lake is a large water body in the land. A lake is used to supply water to its nearest areas. The runoff of water that goes in the lake should be measured correctly and it should be equal to the demand of that area people. Streams are made by the surface. Streams have plenty of water in rainy season but the flow of water in dry season is quite low and it may cause the streams dry. 

The catchment area of both lakes and streams is low. So, the water supply is also low in these water bodies. Therefore, they cannot be used as water supply schemes for large cities. They can only be used for nearby areas and small towns. 

Water Quality
The water of lakes and streams is free from impurities. This water can be utilized safely for drinking water purpose. 

2) RIVERS


Rivers proves as the large source of water supply schemes for Rivers are classified into two categories. Some rivers are perennial that flows throughout the seasons because these are snow fed rivers. Other rivers are Non Perennial rivers that became dry in hot seasons and floods face the rivers in monsoon seasons. It is necessary to utilize the flood water by storing the water in winter through constructing dams and utilize this water in summer. 

The river water can be used for the following purposes:

  • source of water supply for a town
  • used for navigation
  • source of water supply for irrigation
  • used for purification of waste
  • source of recreation activities such as bathing, boating and fishing etc.
Quality of Water


The quality of river water is not consistent. It has silt and suspended impurities. When sewage water (partially or completely treated) is entered into river, then high contamination in rivers is observed. The river water should be analyzed in the perspective of diseases, bacteria and high impurities. River water should be effectively treated before its use as drinking water. Quality of water changes depends upon many parameters such as catchment area, sewage discharges, climate conditions and season of year. The quality of river water is found good at its head and it turns to deteriorating by reaching at its coarse areas. 

Reasons why River Pollution Undesirable

  • Contamination of water leads to increase in pressure on treatment units
  • Effects on fishes life
  • Hindrance of recreational use
  • Hindrance in navigation
  • Irritation by odor and appearance of river water
3) STORAGE RESERVOIRS

An artificial lake made by the construction of dam across a valley is known as storage reservoir. It has three parts:

1) A dam to store water
2) spillway to promote excessive flow of water
3) Gate Chamber having valves to regulate the water flow

These reservoirs present a source of water for large cities. The reservoir water can be used for irrigation and power generation. 

Site Selection for Reservoir

Following points should be considered while selection of a site:
  • land area to be submerged by reservoir construction
  • availability of construction materials
  • elevation of reservoir level
  • availability of skilled labor
  • water quality in reservoir
  • water availability
  • properties of catchment area
  • density of population over catchment area
  • good foundation bed for dams

VIRTUAL WATER


Virtual Water is the water embodied in a product not in real sense but in virtual sense.

The water required to produce a product is known as virtual water.

It is also known as embedded water or exogenous water. Exogenous water is the water that the countries import in virtual sense and it is exogenous to the importing countries.

In quantitative term one approach defined the virtual water content as volume of water that is used in actual to produce the product. It depends on production conditions such as time and place of production and water use efficiency. e.g. for producing 1 kg of grain in arid environment requires two to three times more water than growing the same grain in humid country.
In second approach virtual water is defined with the perspective of user. It is defined as amount of water that would have been required to produce a product at the location where it is produced. 

VALUE OF VIRTUAL WATER
  • In water scarce conditions import of virtual water in water deficient country reduce the pressure on water resources.
  • Virtual water can be seen as alternative source of water.
  • Virtual water can be used as an instrument to solve the geopolitical problems and water wars. 
  • By exporting virtual water products the nations get economic benefits
  • Virtual water trade from high water productive nations to low water productive nations implies real water savings
  • Water Footprint is making a connection between consumption pattern and impacts on water.


FACTORS TO QUANTIFY THE VIRTUAL WATER CONTENT OF PRODUCTS 
  • Virtual water content determination is not an easy task. It depends on many factors such as:
  • The place and period
  • The point of measurement (e.g. either water use is measured at water withdrawal point or at field level).
  • The production method and efficiency of water use.
  • The method of attributing water inputs to intermediate products to virtual water content of final products.


EXECUTION AND EVALUATION OF WASTE ANALYSIS


EXECUTION OF WASTE ANALYSIS

Execution of waste analysis is the third step in waste characterization.

1. COLLECTION OF SAMPLES
  • The Collection team should collect the waste either by emptying the waste containers or by exchanging them with empty ones on regular intervals without informing the property holder who produce this waste to avoid his influence in changing the composition of waste.
  • Each sample should be tagged with a specific reference identification code so that it could be used in wet conditions.
  • The following data must be recorded while collecting waste samples
1)  Sample Address 
2)  Date of Collection
3)  Specific Identification Reference Code
4)  Number and type of waste containers collected
5)  Estimation by seeing the percentage filling level of containers
6)  Estimation of percentage filling level of  other containers at one address for finding the waste amount
  • Number of persons responsible for waste production and collection interval information are useful to give the indication of per capita waste statistics and per household waste statistics.
  • Every waste sample collected must not to be mixed with other waste sample
2. SORTING AND ANALYSIS OF SAMPLES

Each sampling unit is weighed and weight is noted. The sorting of each sampling unit is done separately. The sampling unit is sorted according to a sorting catalog. The catalog will be described in later posts. The catalog has 13 primary waste categories and 35 secondary categories.

Sorting Procedure
  • A waste analysis record sheet (paper copy) is prepared for each sampling unit.
  • The unique code for waste is noted for each sample against waste analysis record.
  • The percentage filling ratio of waste containers is recorded.
  • The sampling unit is weighed with an accuracy of +/- 0.1 kg is recorded.
  • The sorting units can be separated into two fractions above 40 mm and below 40 mm waste category through screens or by screen table. This reduces the effort of sorting.
  • The above 40 mm fraction is sorted into 12 waste primary categories.
  • The below 40 mm fraction is further sorted into two fractions above 10 mm and below 10 mm through 10 mm mesh screen.
  • The below 10 mm waste weight is recorded and considers as "Fines" category.
  • The 10-40 mm waste is weighed too.
The sorting rate recommended is 6 man-hours (sorting team
members) per 100 kg of waste.

EVALUATION OF WASTE ANALYSIS

The evaluation of waste analysis depends upon weight results taken while sorting procedures from all sampling units.

The basic weight results should be transferred from record sheet to excel sheet that will easily calculate the waste composition and required statistical data.

Sample Analysis

Physical analysis is useful in determining the composition o municipal solid waste. Sorting is done for easy handling and management of waste. Water samples are sent to Laboratories for chemical analysis.

Extrapolation

It includes the conclusion from obtained sample results from population.

Presentation of Results

The results presented are:
  • Raw Data
  • Statistical Calculations
  • Evaluation of single results of strata
  • Extrapolation of overall results and waste quantities
  • Graphical representation of results


SOLID WASTE ANALYSIS DESIGN AND PLANNING


The second step in waste characterization is analysis design and planning. 

1. TYPE OF SAMPLING

A sample is a subset of a population that represents the results of whole population. It is necessary to take the sample of waste because it is no possible to analyze the whole population.

Stratified random samples must be used as much as possible. Relevant sources of waste must be sampled from any selected strata. For Example waste bins are able to be sampled from selected strata.

2. NUMBER AND TYPE OF STRATA

The number and kind of strata to be used depends on many factors: waste management information, sufficient resources, need of municipality and availability of sufficient waste planning data. 

Maximum five strata could be used. Above than 5 strata's could lead to requiring more sampling from waste to achieve accuracy in results. More sampling would be time requiring so it is preferred to take 5 strata's not more than this. 

It is more helpful to make a stratification matrix at initial planning stage that provides the necessary data and information for stratification.

3. LEVEL OF SAMPLING

At three levels sampling could be done:
  • Inside household or business e.g. from the internal waste bins
  • Outside household or business e.g. from the external waste bins used for kerbside collection
  • A refuse collection vehicle
It is recommended to use external waste bins outside households and business.


Criteria for Level of Sampling
  • Sample level must fulfill the statistical requirement.
  • Sample leveling should not compromise the  manual sorting procedures
  • Allow correlation and evaluation of household level stratification criteria
4. TYPE OF SAMPLING UNIT

There are 3 main sampling units
  • waste bin with volume of 240 liters
  • specific waste of household or commercial waste with 100 kg weight
  • specific number of persons generating that waste e.g. 30 persons
It is recommended to use volume of waste bin but it is noted that it does not mean the volume of waste within the bin.

5. CALCULATION OF NUMBER OF SAMPLING UNITS AND SAMPLE SIZE

Total number of sampling unit depends on:
  • Variation of waste
  • Accuracy of results
If the variation coefficient of waste is unknown than for different type of waste following sample size must be used
  • household waste 45 meter cube
  • mixed household/commercial waste 80 meter cube
  • commercial waste 100 meter cube
6. DURATION OF WASTE COLLECTION CAMPAIGN

Municipal waste collection should be done on weekly or daily basis. 

It is recommended that waste sampling must cover a week waste e.g. sampling from Monday to Friday covers a full collection cycle and variation due to non collecting waste at weekends .


SOLID WASTE ANALYSIS


WASTE CHARACTERIZATION

The first step in waste characterization is pre-investigation.

1. PRE-INVESTIGATION

1.1 BACKGROUND  INFORMATION

 General Description of the Area under Investigation
  • The area, its location and surface area should be identified.
  • The information includes identification of Geo political areas and all the waste management data available.
General Population Information 

Population information includes:
  • number of inhabitants
  • number of households
  • income level
  • type and proportion of residential structure
Waste Management Information
  • Waste management information deals with:
  • Description of waste management system organization such as actors and their responsibilities
  • Type of waste produced or collected e.g. mixed household waste or co collected household and commercial waste
  • Description of waste containers that are in use such as household bins, communal bins and bins storage capacity
  • Average number of people using bins
  • Total bin volume, their spatial distribution in areas and bins collection intervals
  • method of waste collection such as use of either open trucks or compactors, type of waste collected.
  •  Description of waste collection rounds/route
  • Weighing data of Collection vehicles
  • Waste disposal methods e.g. reuse, recycling, landfill, quantity of waste to be disposed off
1.2 STRATIFICATION

Stratification is the statistical subdivision of parent population (e.g. waste coming from an area) to more homogeneous subgroups or populations (e.g. waste from residential area). 

The changes in strata is small as compared to population changes. This results in:

High accuracy in results at given sample size
Stratification reduces the sample size to reach high accuracy results.

Stratification is not compulsory for waste analysis. But it has the benefit over accuracy of results and additional waste management information.


Stratification Criteria

Following criteria's are seen while stratification:
  • Residential structure
  • Heating systems
  • Bin size
  • Holiday periods
  • Availability of civic amenity sites
  • Type of collection systems
  • Level of Public awareness and education systems


GIS DATA TYPES AND DATA MODELS


GIS stores the information in the form of thematic layers that can be linked together by geography.This presents the complexity off world inn simple form to understand the natural relationships. 

GIS DATA TYPES

GIS technology has two basic types of data that it use.These are:

1. SPATIAL DATA

It represents the relative and absolute locations of a geographic feature.

2. ATTRIBUTE DATA

It provides the properties of spatial features. The properties can be qualitative or quantitative. Attribute data is also known as tabular data.
Examples of spatial and attribute data can be seen as: the coordinate location of forestry stand is spatial data while properties of that forestry stand such as dominant species, cover group, crown closure etc are attribute data.Image data may be considered as spatial data e.g. photographs, movies and it may be attribute data e.g. sound, descriptions or narrations etc.

SPATIAL DATA MODELS

Two basic types of spatial data models exist that store geographic data digitally. These are:
  • Vector
  • Raster 
VECTOR DATA FORMATS

All spatial data models are used to store geographic locations of features in database. Geographic features are represented in the form of vectors is represented by vectors (directional lines).
Vector data is represented in the form of Zero Dimensional Objects, One Dimensional Objects and Two Dimensional Objects. Zero dimension objects are Point and Node. Point is defined as a single X,Y coordinate to specify a geometric location. Node is a topological junction that also represents the geometric location. One Dimension Objects are Line Segment, Link, Directed Link, String, Chain, Arc and Ring. Line segment is a direct link between two end points. Link is the connection between two end nodes. Direct link is connection between two nodes with one direction. String is a sequence of line segments. Two dimension objects are Simple Area / Polygon , Complex Area / Polygon , Raster Cell / Pixel.  Simple Area / Polygon is a outer ring that may not have inner ring while complex are/ polygon has outer ring with inner ring as well. Pixel is two dimension object of an element of regular tessellation of a surface. 

TYPES OF VECTOR DATA MODELS
  •  The Spaghetti  Data Model 
  •  Topological Data Model 
  •  Triangular Irregular Data Model (TIN) 
  •  Shape Files (Arc View, Arc GIS Files) 
  •  Digital Line Graph (DLG) 

Spaghetti  Data Model 

In this model point, line and area/polygon concept is given as described earlier. Polygon is a closed loop of coordinates that has its boundary. The common boundary between adjacent polygon is considered two times for each polygon. A file of  spatial data prepared in this way is a collection of strings having coordinates with no inherent structure is known as Spaghetti Data Model. This model is not efficient for spatial analysis.

Topological Data Models


It is mostly used model for encoding spatial relationships in GIS. Topology is defined as a mathematical method to define spatial relationships. It is also called as Arc Node Model.  Arc is a series of points that start and end at a node. While node is a point where two arcs intersects. Dangling Node is a node that is not connected to an other node. 

TIN Data Model


Triangular Irregular Network (TIN ) is a Type of vector data model used to describe the terrain data. Triangular sides are used to show terrain. Three vertices X,Y coordinates and Z values are stored against each side. Each triangle has three nodes. Coordinates and topology are stored in different tables. Slope and aspect are measured for every facets. Hardware and software should be more effective to manage large amount of TIN data. It is more accurate than raster models.

RASTER DATA MODELS

Real World in raster data format is represented in the form of square shaped small boxes uniform in size. Locations of geographic features are represented in the form of rows and columns. The area of each cell shows its spatial resolution. A point is represented by a single cell and a line is shown by group of cells combined together. In line each cell has a same attribute value. Each cell has a specific attribute value. Cluster of cells having same value is known as polygon. The small area depicts the higher resolution. Thus larger files are needed to store the data. So, raster cells are larger in size.


GIS INTRODUCTION AND ITS FUNCTIONAL SUBSYSTEMS


INTRODUCTION

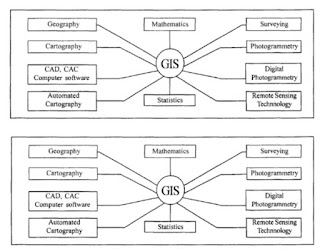
GIS (Geographic Information System) is a computer based tool used to store and operate geographic information. It deals with mapping and analyzing things happening on earth. GIS is known for explaining events, predicting results an planning strategies and that is why it is found different from other information systems and valuable to public and private enterprises.

GIS aim is management, analysis and visualization/ mapping of spatial data. The definition of GIS quoted by Burrough is:

"GIS is a powerful set of tools for collecting, storing, retrieving at will, transform and displaying spatial data from the real world."

GIS APPLICATIONS

GIS has the potential to be used in various fields. The problems faced by world today are overpopulation, pollution, deforestation, natural disasters. These challenges have critical geographic perspective.
GIS is used while selection of suitable site for business, finding best soil to grow crops, finding the best route for emergency vehicles. GIS is used to build maps, gather information, visualize scenarios, solve complex problems, present useful ideas and effective solutions for problems. GIS performs tasks better than manual methods.

FUNCTIONAL SUBSYSTEMS

A GIS has four functional subsystems. They are as follows:
  • Data Input Subsystem
  • Dta storage and retrieval subsystem
  • Data manipulation and analysis subsystem
  • Output/display subsystem
DATA INPUT

Data input deals with collecting, capturing and transforming the spatial and thematic data into digital form. Data input comes from aerial photographs, hard copy maps, remotely sensed images, reports, surveys, documents etc.

DATA STORAGE AND RETRIEVAL SUBSYSTEM

This subsystems organize the spatial and attribute data in a form the allows the users to retrieve this data quickly for analysis and allows correct updates to be done in database.

DATA MANIPULATION AND ANALYSIS SUBSYSTEM

This subsystem permits the user to define and implement spatial and attribute procedures to produce derived information. This subsystem is considered as heart of GIS.

OUTPUT/DISPLAY SUBSYSTEM

This subsystem allows graphic display, maps generation and tabular reports that show derived information products.


WORLD SUMMIT ON SUSTAINABLE DEVELOPMENT & WEHAB DISCUSSIONS


World Summit on Sustainable Development was held in Johannesburg in 2002. Summit should provide benefit to youth, children and vulnerable community. For sustainable development good governance is necessary in each country at international level.
Peace, security, stability, respect for human rights, fundamental freedom are all necessary for sustainable development.

SECTIONS
   
  • Introduction
  • Poverty Eradication
  • Changing unsustainable to sustainable patterns
  • Protecting and managing natural resources
  • Sustainable Development in Globalizing World
  • Health and Sustainable Development
  • Sustainable Development of Small Islands

Partnership Plenary Sessions
WEHAB DISCUSSIONS
SUMMARY

The WEHAB discussions were carried out in plenary in response to decision at prepcom IV. Five key sessions were discussed in WEHAB discussions by UN Secretary General Kofi Annan (contributor in World Summit on Sustainable Development): Water, Energy, Health, Agriculture and Biodiversity.

WEHAB SESSIONS

Health

Good health is essential for poverty eradication and sustainable development. Health is not all about reducing illness but it also deal with human rights to clean water, sanitation, quality and better health services. People who are poor are more at risk of illness and people who are ill are more likely to be poor. Health and Environment link should be given recognition. Health issues must be addressed by Health ministries and health sectors.
Most speakers agreed on following actions that must be held to address health issues:
  • Eradicate communicable diseases such as AIDS/ HIV , malaria, tuberculosis.
  • Treatment of common diseases such as diarrhea and respiratory diseases from pollution
  • Prevent and treat occupational health diseases and accidents
  • Improve access to sanitation and clean water
  • protection of health of vulnerable population
  • Gender Empowerment
Many speakers identified the need of following issues for achieving success in health issues:
  • Strong political will and long term commitment
  • Effective politics and strategies
  • Practical programmes on ground with clear targets
  • Partnership based on scientific knowledge, research and useful information
Participants identified the need of capacity building and research for:
  • assessing and managing health risks
  • planing and managing health needs
  • training good health care providers
Other discussions were:
  • learning from past lessons and best practices
  • committing global funding for HIV/AIDS, malaria and tuberculosis 
  • more resources for health of children
  • developing international code of conduct fro health personnel
Biodiversity

About 40 % of global economy depends upon biological products and processes. The economical value o biodiversity is found to be $ 2.9 trillion/year while economic services value is $3.3 trillion/year.
The threats on biological biodiversity by humans should be given attention. The biodiversity and poverty linkage should be given priority as poor people depends on biodiversity for their survival.
Challenge to biodiversity are:
  • ensuring equal benefits from the use of biodiversity
  • improving the knowledge of public about the importance of biodiversity
  • recognition of cultural and spiritual values of biodiversity
  • addressing need of paradigm shift
  • special conservation for the biodiversity areas and weak ecosystems
To address these challenges the participants pointed out following suggestions:
  • Better process and mechanism for strong action and implementation
  • use economic instruments in relation to biodiversity
  • build biodiversity related conventions
  • sharing more global and regional research
  • build capacities and technology sharing
  • address issues of Intellectual Property Rights
Agriculture

The key issues of agriculture in developing countries were:
  • Soil fertility problem in Sub Sahara Africa developing countries
  • need to increase water productivity
  • enhanced use of diverse crops, non farming practices as a source employment in rural areas
  • need to involve farmers in policy and decision making
  • addressing land tenure and land rights issues
  • providing financial incentives in key areas
  • strengthening warning practice against natural disasters
  • preventive actions to reduce hunger and enhance agriculture productivity
The need to address these issues were discussed by participants as:
  • Increase technological improvements (renewable technology, safe use of biotechnology)
  • increase public investment in agriculture and build markets
  • develop products that are marketable and promote market supplies
Special consideration in term of human resources should be given to:
  • Empowerment of women in order to reduce hunger 
  • Retaining youth in agriculture
  • identifying the needs of waged agricultural works and conditions
  • empowerment of local communities
Water and Sanitation

The issues in water and sanitation are as follows:

1.Access and availability
  • need of access of safe and quality water and sanitation to poor rural areas or in marginal urban areas
  • need of policies to pay for the services of poor population
  • need of decentralized solutions for meeting the needs of poor by less costly technologies
Allocation Issues
  • Integrated water resource managment should be promoted
  • Agriculture use highest water share there is the need to improve water use efficiency
  • Populations cannot pay for the services. The poor community should be taken into account in this perspective.
Capacity Building and technology need
  • need to introduce and maintain the technologies for poor
  • need of capacity building and education in water management and sanitation
  • education, information and public awareness is necessary

Energy

The issues in energy sector discussed were:
  • need of energy efficiency and conservation
  • importance of energy and health link
  • importance of clean energy sources
  • countries ability to take their own decisions in energy policies
  • need to restructure markets
  • need of safety nets for workers
Energy objectives discussed in discussion are:
  • Energy for poverty alleviation
  • Energy conservation and energy efficiency
  • Promotion of renewable energy
  • use of policies and economic instruments
  • meeting the needs of women
  • actions on climate change


CONCEPT OF GOVERNANCE AND GOOD GOVERNANCE IN ENVIRONMENT


GOVERNANCE


"Governance means a process of decision making and a process of implementation of these decisions."

Governance can be termed in different concepts such as International governance, Local governance, National governance and corporate governance. Both Formal and Informal actors are involved in decision making and in the process by which decisions are implemented. Formal and Informal structures are also set in place to make decision and to implement them.

Government is one of the actor in governance. In rural areas the actors involved other than government are: land lords, cooperatives, associations of peasant farmers, NGOs, research institutes, political leaders, religious leaders, finance institutes and military etc.  In urban areas the situation is more complex. Here in addition to above actors in rural areas at national level media lobbyists, international donors and multi national corporation are included. 

All actors other than government and military make a civil society. In some countries organized crime syndicates also perform decision making. In informal decision making Kitchen Cabinets or informal advisers also do decision making. In rural areas powerful local families affect decision making.

GOOD GOVERNANCE

Good governance ensures the minimization of corruption, hearing of minorities views, voices of vulnerable in society are heared.

CHARACTERISTICS OF GOOD GOVERNANCE

1. PARTICIPATION

Participation should involve both men and women in decision making. I should be organized and informed. participation could be direct or through intermediate institution.

2. RULE OF LAW

Good Governance require legal frameworks to be enforced. For the enforcement of laws independent judiciary, incorruptible police force are required.  Good governance need to protect the human rights.

3. TRANSPARENCY

Transparency means that decision taken and their enforcement should be in a way that follows rules and regulations. It also reflects that information is easily available to the people that are mostly affected by decision making. Information should be in understandable form.

4. RESPONSIVENESS

In good governance institutions and processes should serve all stakeholders within time frame.

5. CONSENSUS ORIENTED

Good governance requires what is needed for sustainable human development, what is best interest for the community. This results in understanding of historical, cultural and social perspective of society. 

6. EQUITY AND INCLUSIVENESS

All members should consider they have stake in it and they are not separate from the main society. 

7. EFFECTIVENESS AND EFFICIENCY

The efficiency in term of good governance deals with sustainable use of natural resources. Institutions produce best results to meet the needs of human society.

8. ACCOUNTABILITY

Government institutions, private sector and civil society organizations must be accountable to public and institutional stakeholders.


EX- SITU CONSERVATION STRATEGIES


Broadly the conservation strategies are divide into two types . They are:

  • On Site Preservation
  • Off Site or Ex Situ preservation
On Situ Preservation

The best strategy to conserve species is to preserve them in wild in their natural communities. This is known as π or On site preservation. Natural communities are evolutionary adapted to the changing environment. In the wild species genetic variability is not lost by genetic drift. But on site preservation is not suitable for many rare and endangered species. They go extinct due to many reasons ass described in earlier posts. These are: genetic erosion, deteriorating habitat, changes in environment, competition from exotic species, disease and excessive hunting.

Ex Situ or Off-Site Preservation

When the remaining population is too small or when the individuals are found outside the protected area than on site preservation may not be effective. Than the species are preserved in an artificial condition under human supervision. This strategy is known as off site or ex situ preservation. A number of species that have extinct are already grown in captivity e.g. Elaphurus Davidianus and Equus caballus przewalski. 

Ex Situ Facilities for animal preservation are:
  • Zoos
  • Game Farms
  • Aquaria
  • Private Breeders
Ex Situ Facilities for plants preservation are:
  • Botanical Gardens
  • Arboreta
  • Seed Banks
The strategy that combines these two strategies is the protection of rare and endangered species in small protected areas. The species are somewhat wild but human intervention is necessary there to prevent loss of species.
Long term ex situ conservation reduce the need of research and display of wild collected individuals. In situ preservation is necessary for the conservation of those species that are difficult to raise in captivity or in zoos or botanical gardens.

Ex Situ Conservation Limitations in Comparison with In Situ Preservation

1. Population Size

To prevent genetic drift several hundreds of populations need to be maintained in ex situ preservation. No zoo can preserve such large quantity of animals and only few animal species could be kept in captivity. In botanical garden one or few individuals of species could be maintained.

2. Adaptation

Ex situ populations may have genetic adaptations when kept in captivity for several generations due to changes in their mouth parts and digestive systems by the food of zoo. When these animals are returned to wild they might not adapt to eat their natural food in wild.

3. Learning Skills

Learning skills could not be develop in to captive bred individuals. When they are returned to wild they are not able to find their food, they can not judge their predators and not know how to compete with them. The problem is worse in social animals in juveniles who learn from their parent members in their group. 

4. Genetic Variability

Ex situ conserved species have limited gene pool. The species collected from warm low land areas for captivity may not be able to adapt for cold in cold high land areas.

5. Continuity

This conservation needs continuous supply of funds and institutional policy. Frozen, chilled collection of sperms, eggs, seeds and tissues are affected by loss of electric power. 

6. Concentration

Ex situ efforts are done at smaller places. There is a danger to the entire population when any disaster come.

7. Surplus Animals

Surplus animals could not be kept in captivity. In zoo only few species can be bred.